15 September 2025
Written by MYTHEO

1. Growth Portfolio
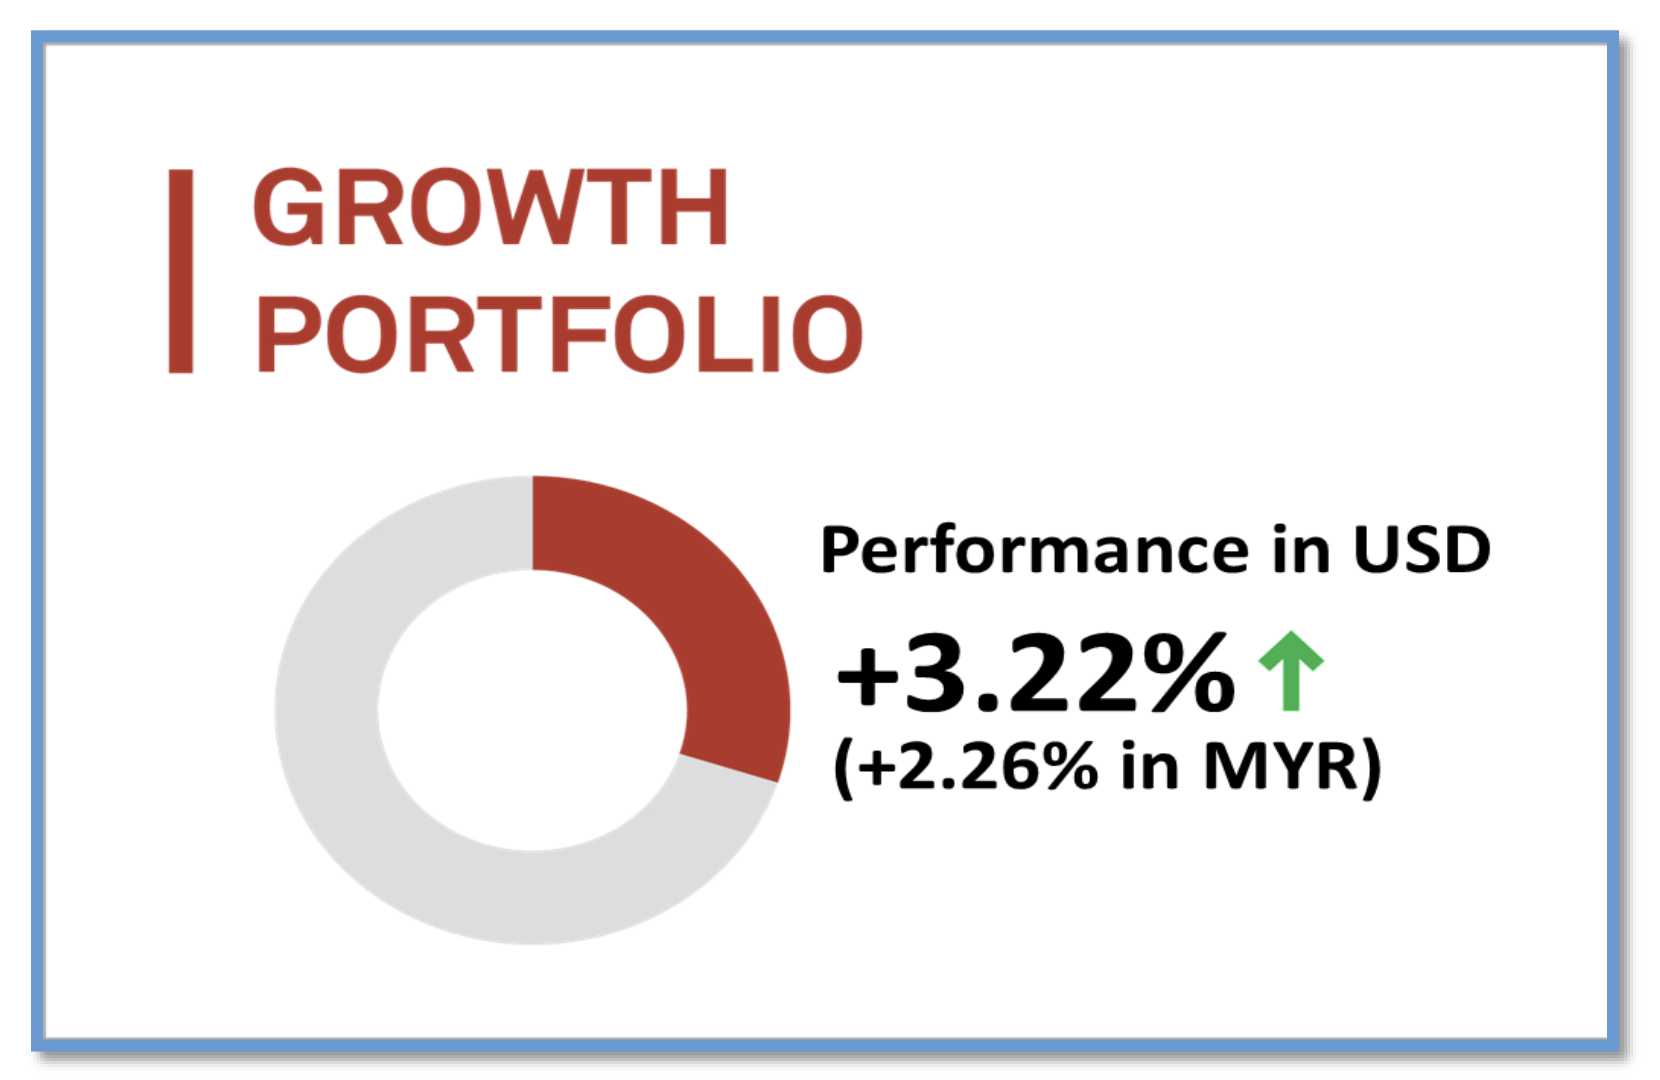
MYTHEO's Growth Portfolio was up by 3.22% (up by 2.26% in MYR) in August 2025.
MYTHEO's Growth Portfolio delivered another strong month, marking its fourth consecutive month of positive returns. All ETFs within the portfolio posted gains, ranging from 0.76% to 5.65%.
Unlike the previous month, when performance was largely driven by major US technology companies, August saw a shift in market leadership. Growth stocks (VUG), which include many of these large-cap tech names, were among the laggards as investors rotated their capital outside the US.
The strongest performance came from international markets, with Canada (EWC), Asia Pacific (VPL), and the United Kingdom (EWU) leading the way, rising 5.65%, 5.00% and 4.14% respectively.
Top 3 ETFs performance (Growth portfolio)
Bottom 3 ETFs performance (Growth portfolio)
Source: GAX MD Sdn Bhd, data in USD term for the month of August 2025.
2. Income Portfolio
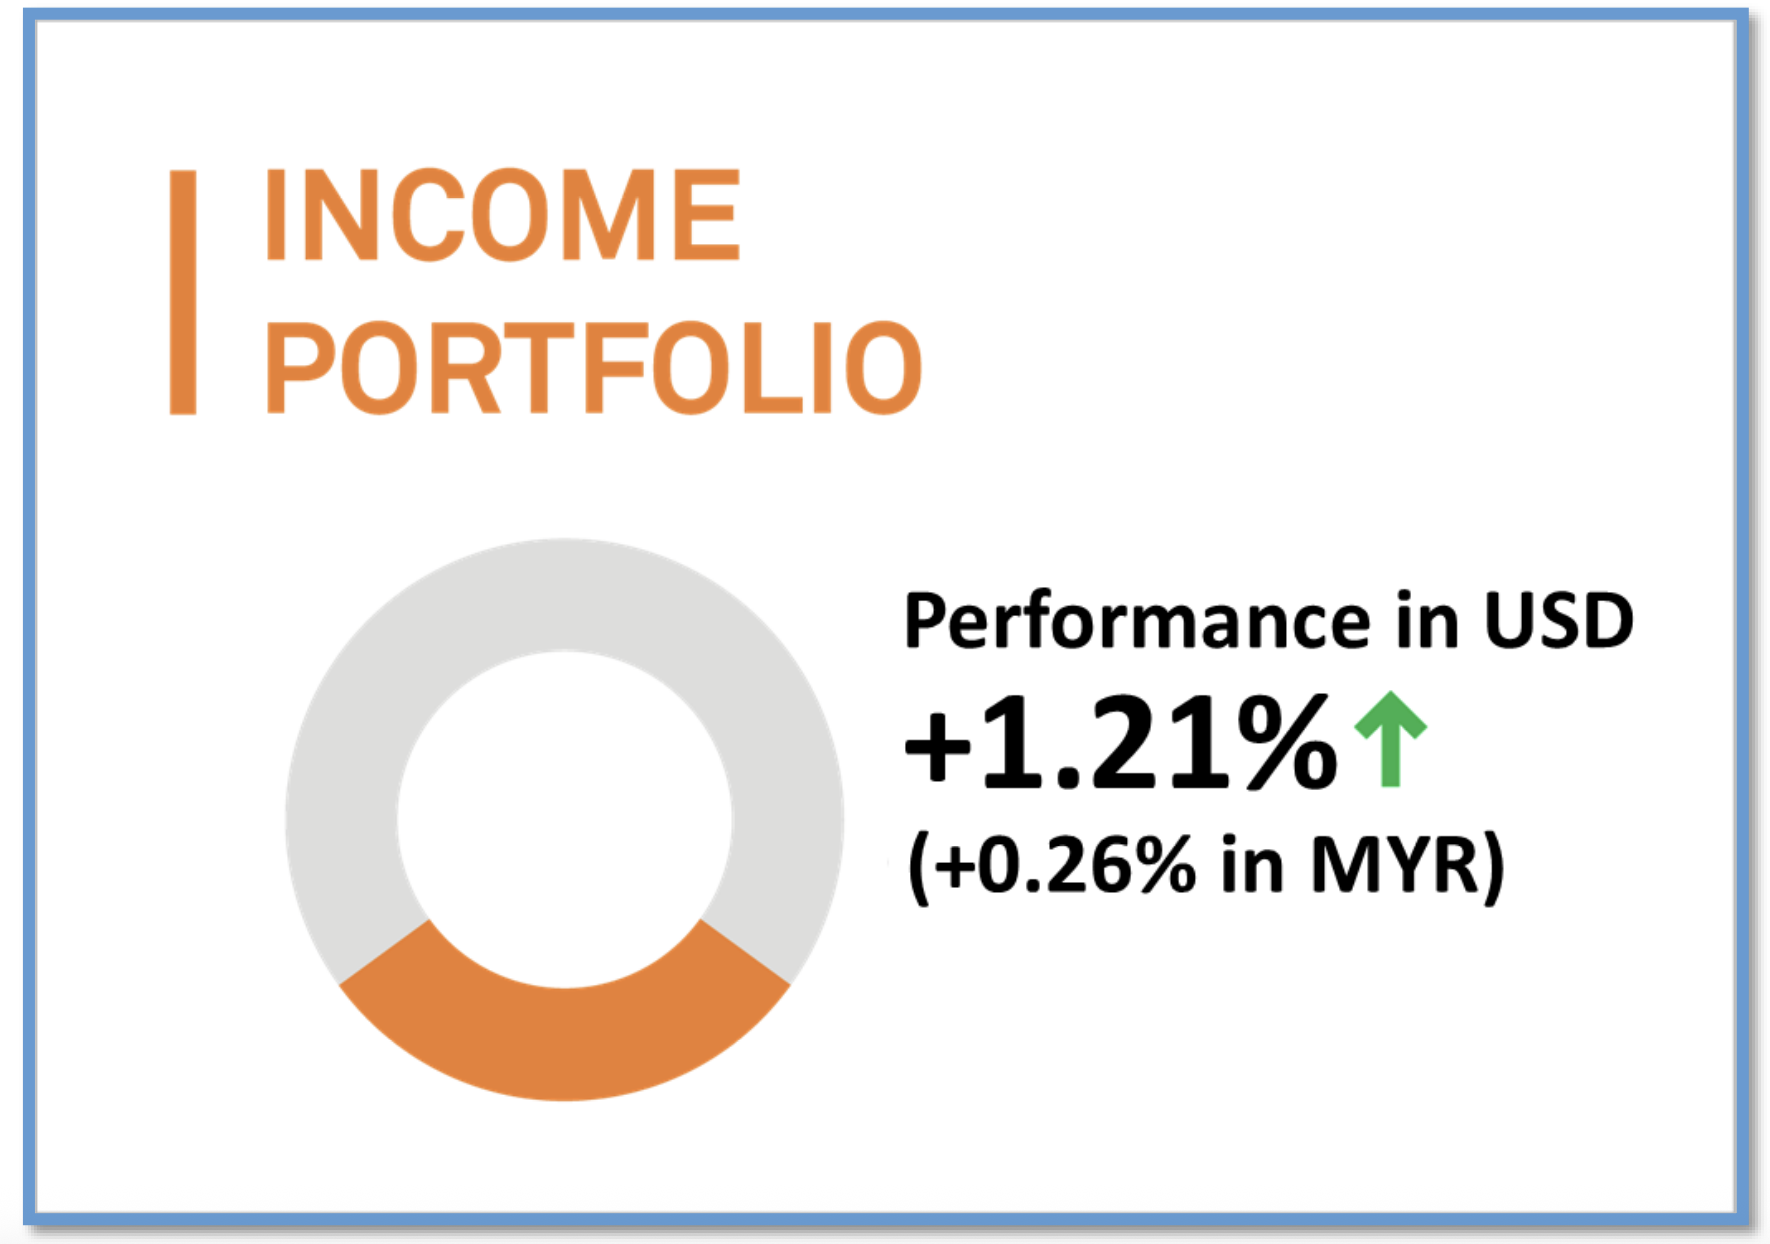
In August 2025, MYTHEO's Income Portfolio increased by 1.21% in USD terms and recorded a gain of 0.26% in MYR terms.
Following Chair Powell's remarks at the Jackson Hole Symposium on August 22, where he hinted that the Federal Reserve may cut interest rates in September amid signs of labour market weakness, markets quickly began pricing in a potential policy shift. Even so, the impact on the MYTHEO Income Portfolio was relatively muted due to the mixed performance of US short-term and long-term Treasuries.
US short-term Treasuries with 3–7 years to maturity (IGSB) posted a modest gain of 0.68%, supported by optimism over potential rate cuts. In contrast, long-term Treasuries with maturities beyond 20 years (TLT) fell 0.37% as persistent inflation concerns continued to weigh on sentiment.
Overall, portfolio gains were largely driven by US dollar weakness, which boosted returns for international government bonds (IGOV) and emerging market bonds denominated in local currencies (EMLC). These were the strongest contributors, delivering gains of 2.34% and 1.97% respectively.
Top 3 ETFs performance (Income portfolio)
Bottom 3 ETFs performance (Income portfolio)
Source: GAX MD Sdn Bhd, data in USD term for the month of August 2025.
3. Inflation Hedge Portfolio

In August 2025, MYTHEO's Inflation Hedge Portfolio recorded a strong gain of 3.08% (a gain of 2.11% in MYR).
MYTHEO's Inflation Hedge Portfolio delivered another solid month in August, with all ETFs posting gains except for the oil ETF (DBO). After leading the portfolio in July, DBO fell 5.09% as crude oil prices pulled back. The drop came after India chose to continue importing Russian crude without formally responding to former President Donald Trump's tariff threats. India effectively began paying the additional 25% tariff on exports to the US, easing fears of supply disruptions and driving oil prices lower.
Despite the weakness in oil, three ETFs posted impressive gains of more than 7% during the month. Silver (SLV) led the way, surging 8.61% as investors continued to view it as undervalued relative to gold. Clean Energy (ICLN) climbed 7.31%, fueled by a strong rally in solar energy stocks, which account for more than a quarter of its holdings.
Agriculture (DBA) gained 7.22%, supported by a nearly 45% spike in coffee prices in August. The rally was triggered by severe weather conditions in Brazil, including drought and irregular rainfall which raised supply concerns and dampened hopes for a record harvest in 2026. Brazil remains the world's largest coffee producer, responsible for about 30% of global exports.
Top 3 ETFs performance (Inflation Hedge portfolio)
Bottom 3 ETFs performance (Inflation Hedge portfolio)
Source: GAX MD Sdn Bhd, data in USD term for the month of August 2025.
4. Global ESG Portfolio
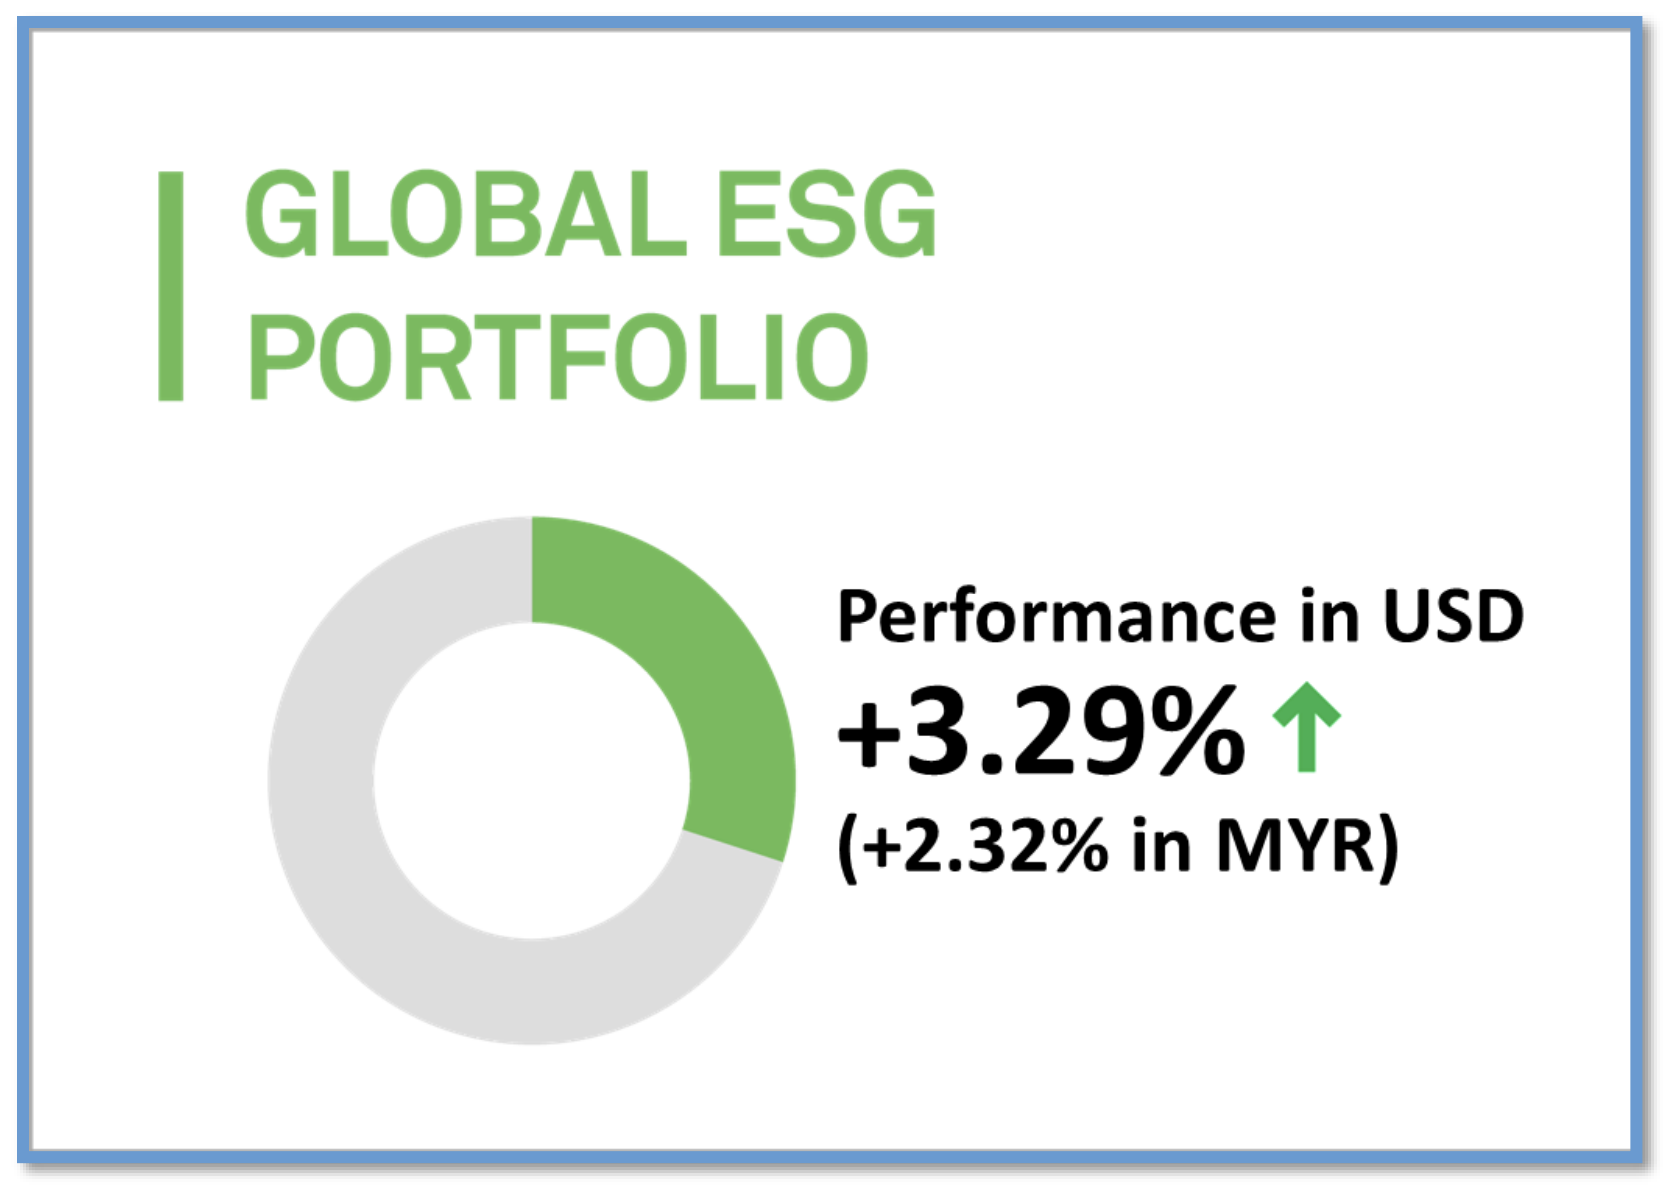
MYTHEO's Global ESG rose by 3.29% (rose by 2.32% in MYR) in August 2025.
August saw a major rotation in the markets after China urged its top companies to stop buying chips from Nvidia and AMD. This move rattled tech investors and sparked a shift into previously lagging sectors, with money flowing into international markets and US value stocks.
As a result, the portfolio's top performers were ESG Aware EAFE (ESGD), which focuses on developed markets outside the US and Canada, NULV, which targets US value stocks, and SUSA, an ETF comprising premium US stocks.
Top 3 ETFs performance (Global ESG portfolio)
Bottom 3 performance ETFs (Global ESG portfolio)
Source: GAX MD Sdn Bhd, data in USD term for the month of August 2025.
5. Essential Products Portfolio
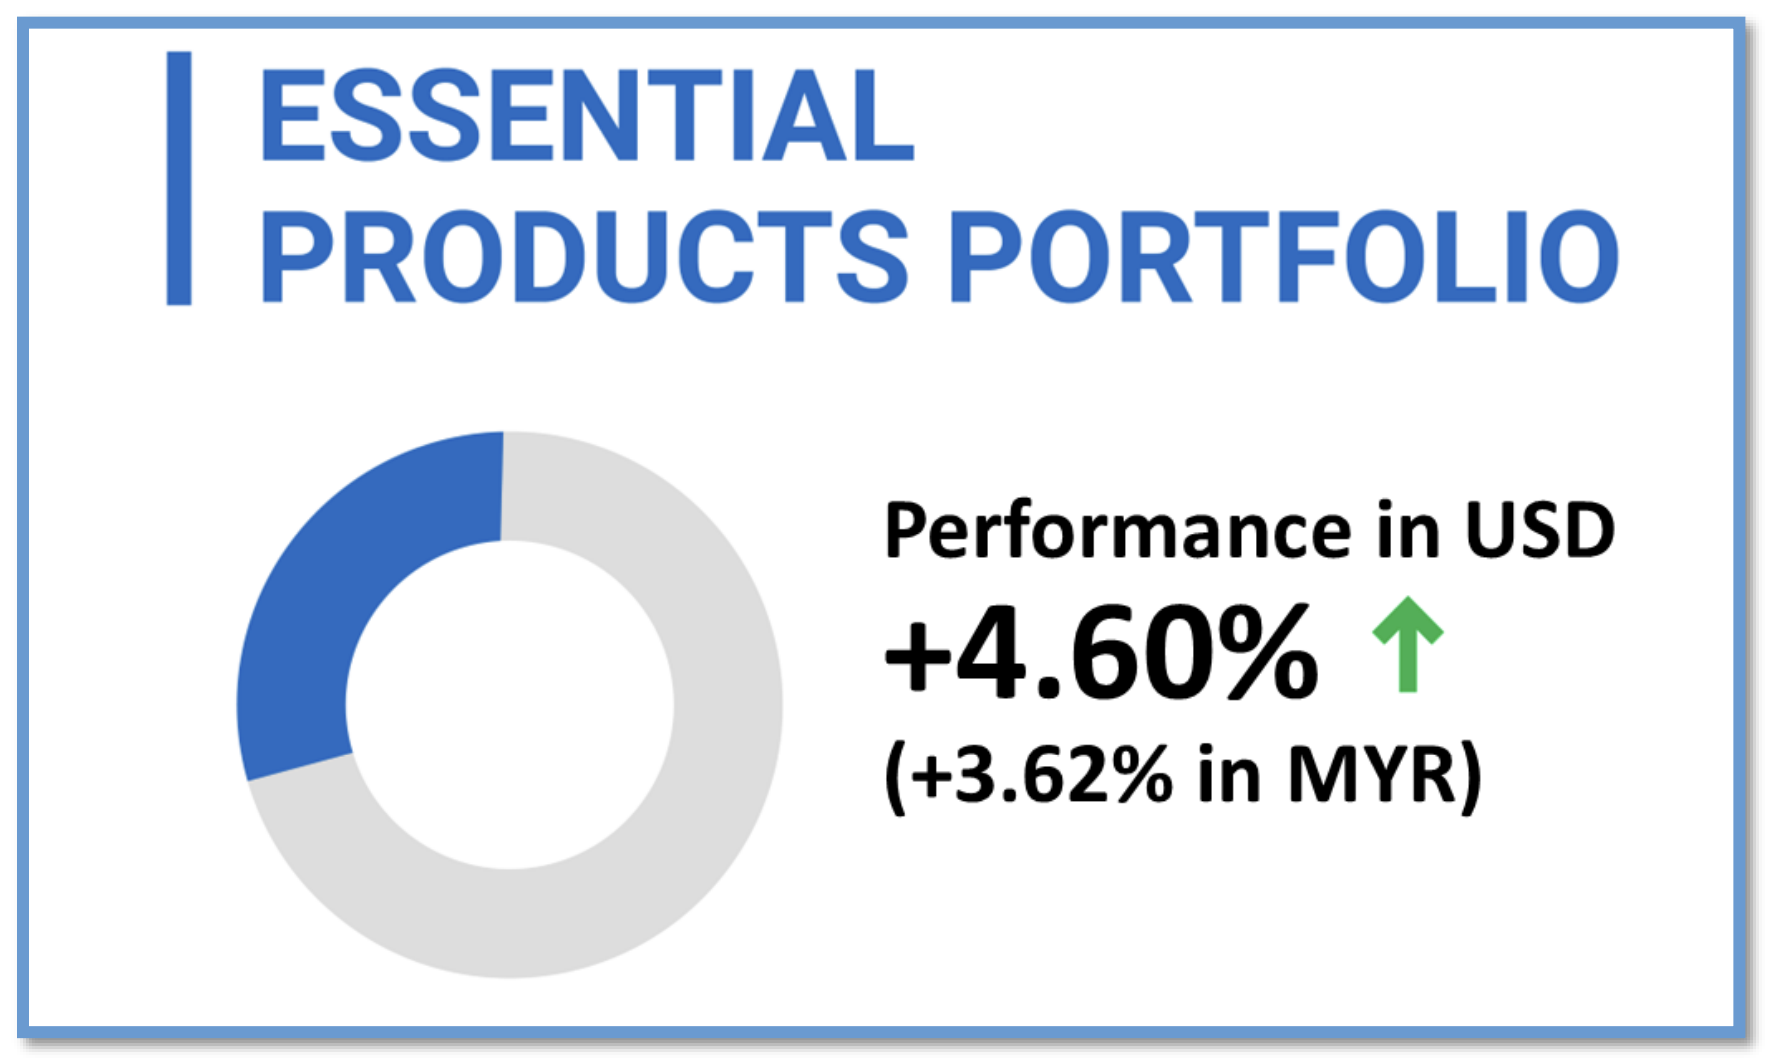
MYTHEO's Essential Products portfolio gain by 4.60% (increased by 3.62% in MYR) in August 2025.
MYTHEO's Essential Portfolio had a stellar August, jumping 4.60% thanks to substantial gains in lithium and solar energy. The Lithium ETF (LIT) stole the spotlight, soaring 15.81% to become the portfolio's top performer.
The rally in lithium was sparked by market-moving news from Contemporary Amperex Technology (CATL), the world's largest EV battery producer, which halted production at a major lithium mine in Jiangxi Province, after its license expired on August 9. The unexpected shutdown raised fears of a supply crunch, sending lithium prices surging and boosting related stocks across the sector.
Clean energy also played a major role in August's gains. The iShares Global Clean Energy ETF (ICLN) climbed more than 7%, driven by a rally in solar stocks after the US Treasury Department unveiled new, less restrictive subsidy rules for clean energy projects on August 19. Solar remains the backbone of ICLN, accounting for over 26% of its exposure, with First Solar Inc. as its largest single holding at more than 9%.
Top 3 ETFs performance (Essential Products portfolio)
Bottom 3 ETFs performance (Essential products portfolio)
Source: GAX MD Sdn Bhd, data in USD term for the month of August 2025.
6. Izdihar Portfolio
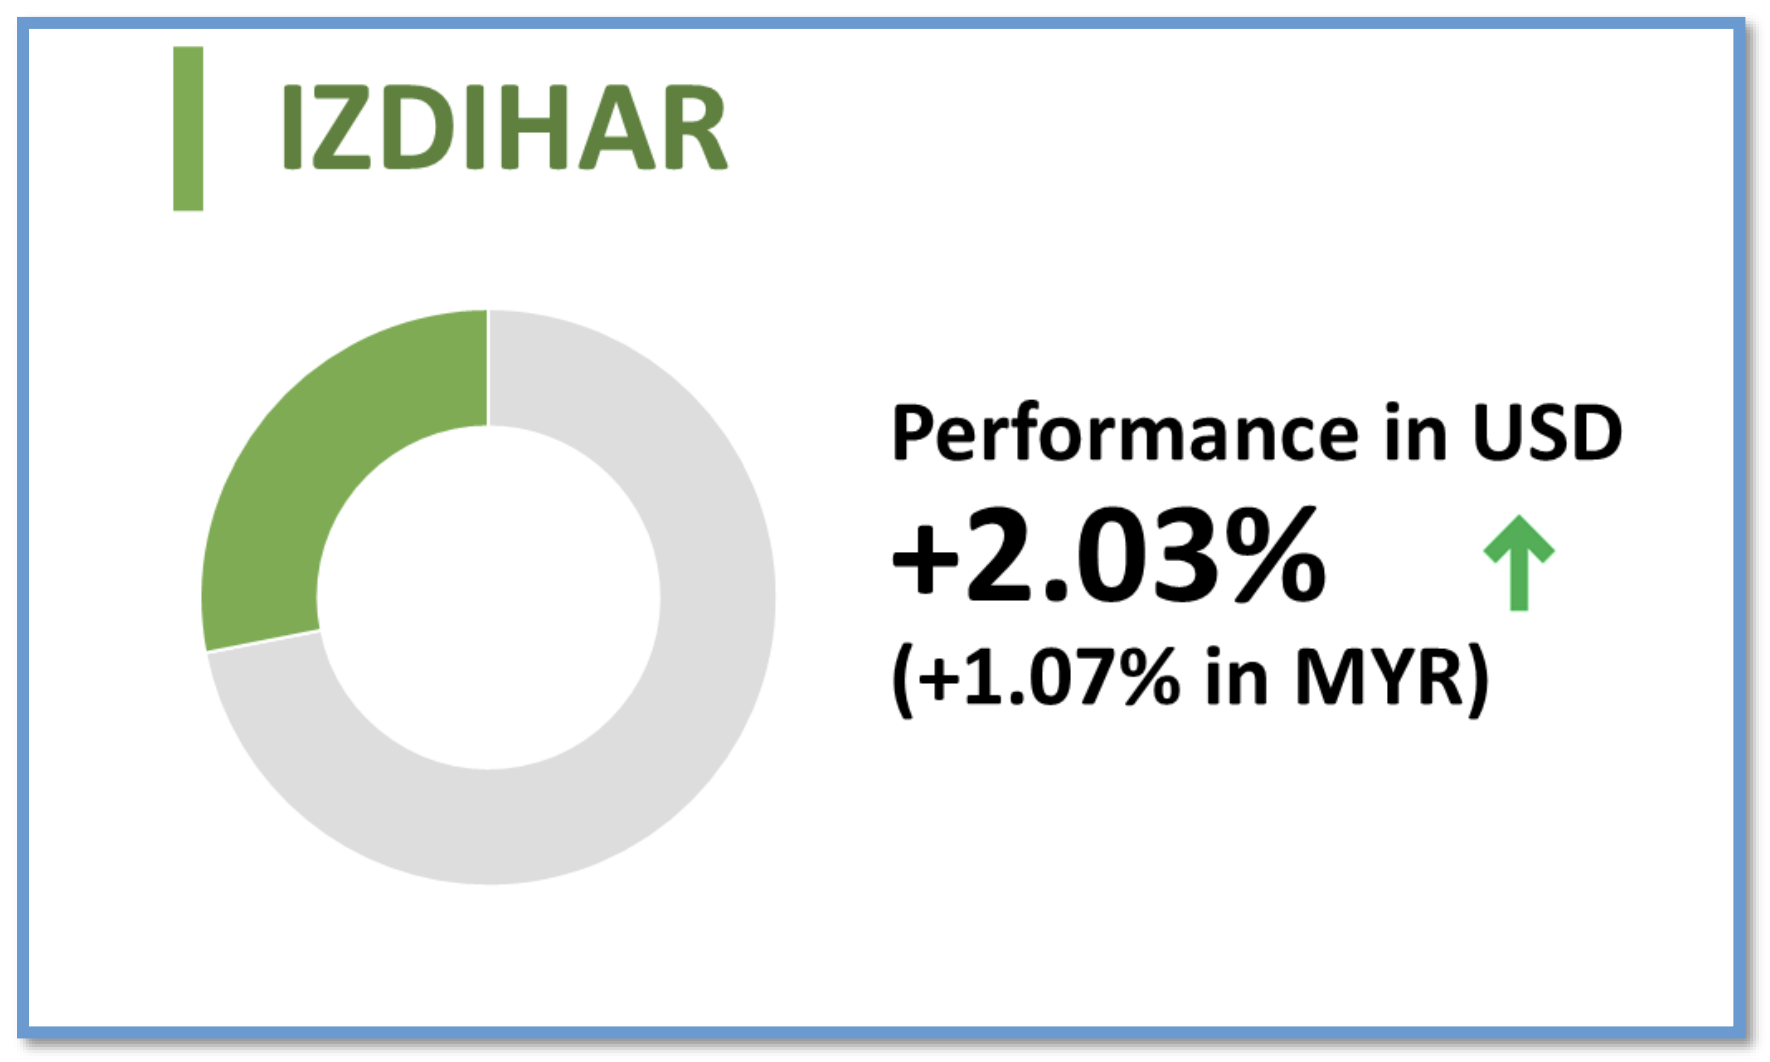
MYTHEO Izdihar portfolio posted a gain of 2.03% (a gain of 1.07% in MYR) in August 2025.
MYTHEO Izdihar wrapped up its first full month since launching on July 16, 2025, with a solid gain of 1.07% in MYR, as all five ETFs in the portfolio finished in positive territory.
The results could have been even stronger if not for the renewed technology tensions between the US and China. While President Trump struck a deal allowing Nvidia and AMD to sell chips to China in exchange for a 15% tax paid to the US government, Beijing responded by urging its domestic tech giants to avoid using these chips.
This weighed heavily on the Technology ETF (SPTE), which ended the month with a modest 0.54% gain, significantly trailing the rest of the portfolio. The FTSE USA Shariah ETF was the top performer, supported by its relatively smaller exposure to the technology sector.
Top 3 ETFs performance (Izdihar portfolio)
Bottom 3 ETFs performance (Izdihar portfolio)
Source: GAX MD Sdn Bhd, data in USD term for the month of August 2025.
YTD Portfolio Return in % (MYR)
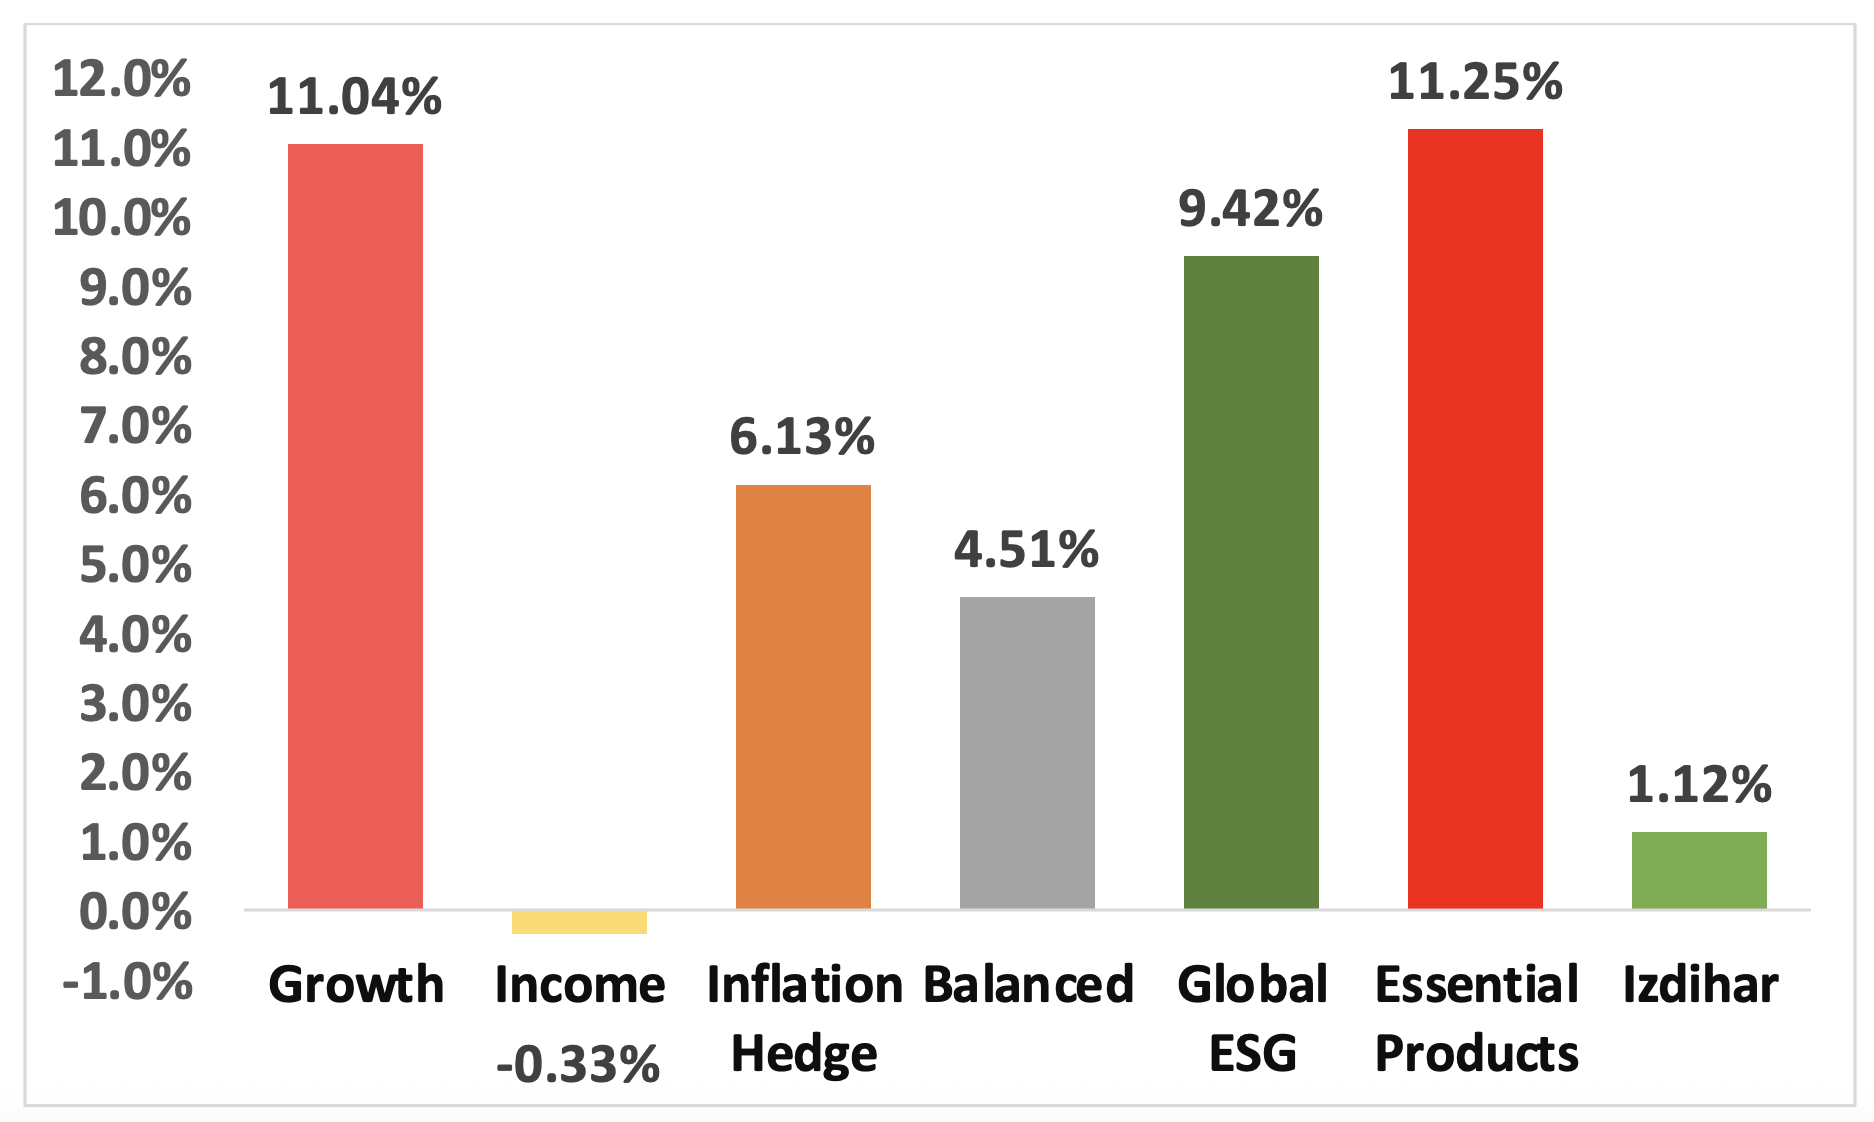
Source: GAX MD Sdn Bhd, August 2025
Note: Past performance is not an indication of future performance
*Balanced allocation consists of 30% Growth, 47% Income and 23% Inflation Hedge
The Izdihar portfolio YTD performance is calculated from July 17, 2025, aligning with its official launch date.
US Fed Rate Probabilities for 17 September Meeting
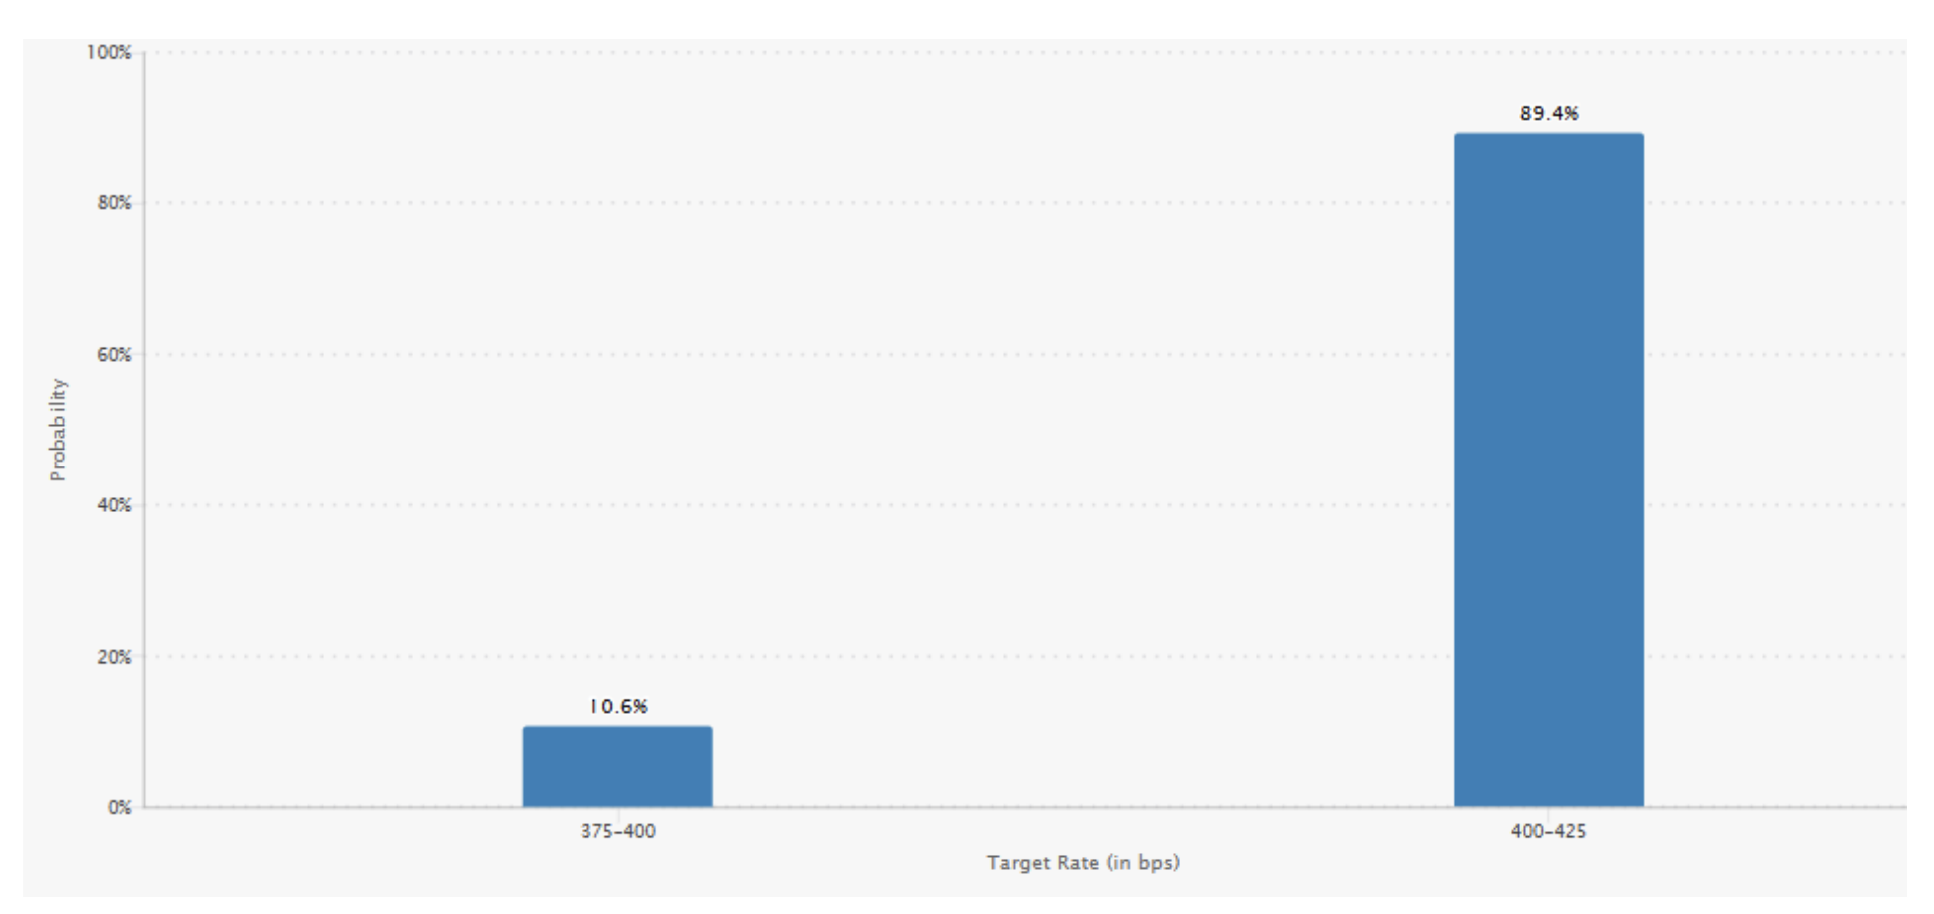
Source: CME Fed Watch, September 2025
On the trade front, Trump so-called reciprocal tariffs on nearly all major US trading partners took effect on August 7. The 90-day delay on high tariffs for Chinese goods was extended until November 6, and India was hit hard with its exports to the US burdened with a 825% levy starting August 27.
On August 4, US appeals court ruled that many of Trump's global tariffs are illegal. Markets largely shrugged off the news, as the ruling will not take effect until October 14, giving the administration time to petition the Supreme Court. The earliest possible hearing would be held in November, and a final decision could stretch into mid-2026.
For now, the Trump administration is moving ahead with implementation, a development that could push inflation higher in the coming months and create short-term headwinds for our long-duration Treasuries inside our Income portfolio. However, the Income portfolio's diversified, expectation of low interest rate globally would be supported by short-term treasury and international treasuries.
By contrast, our Inflation Hedge portfolio stands to benefit from a higher-inflation, lower-rate environment where Inflation Hedge bonds or TIPs that perform well in these conditions, and precious metals could see renewed demand as investors seek safety amid economic and policy uncertainty.
As for our Growth portfolio, we do not view inflation as a major threat as long as it does not choke off consumer spending. In fact, we expect technology and AI companies to remain resilient to economic and policy development.
Our view is reinforced by the latest earnings from Nvidia and Broadcom. Nvidia once again delivered a blockbuster quarter, with revenue and net profit up 50% and 59% year-over-year, respectively. Its Data Center division continued to be the main growth engine, while its autonomous driving segment grew an impressive 68%, suggesting an evolution of new future growth.
Broadcom also posted strong results, with revenue up 22% and profit surging 88.35%. Its AI division was the standout, with revenue jumping 63%, underscoring the company's growing importance in the AI ecosystem.
Ultimately, our view remains the same: investors should stay focused on their long-term goals. Markets will always respond to changing macroeconomic conditions and policy developments, but what truly matters is how inflation and growth evolve over time. As recent results from Nvidia and Broadcom show, the new economy continues to expand, with sectors such as Data Centers, Artificial Intelligence, and Autonomous Driving leading the way.
Discover how MYTHEO can enhance your portfolio diversification today and embark on your financial journey with confidence. Take the first step towards your financial goals now .
This material is subject to MYTHEO’s Notice and Disclaimer.


