15 August 2025
Written by MYTHEO
1. Growth Portfolio
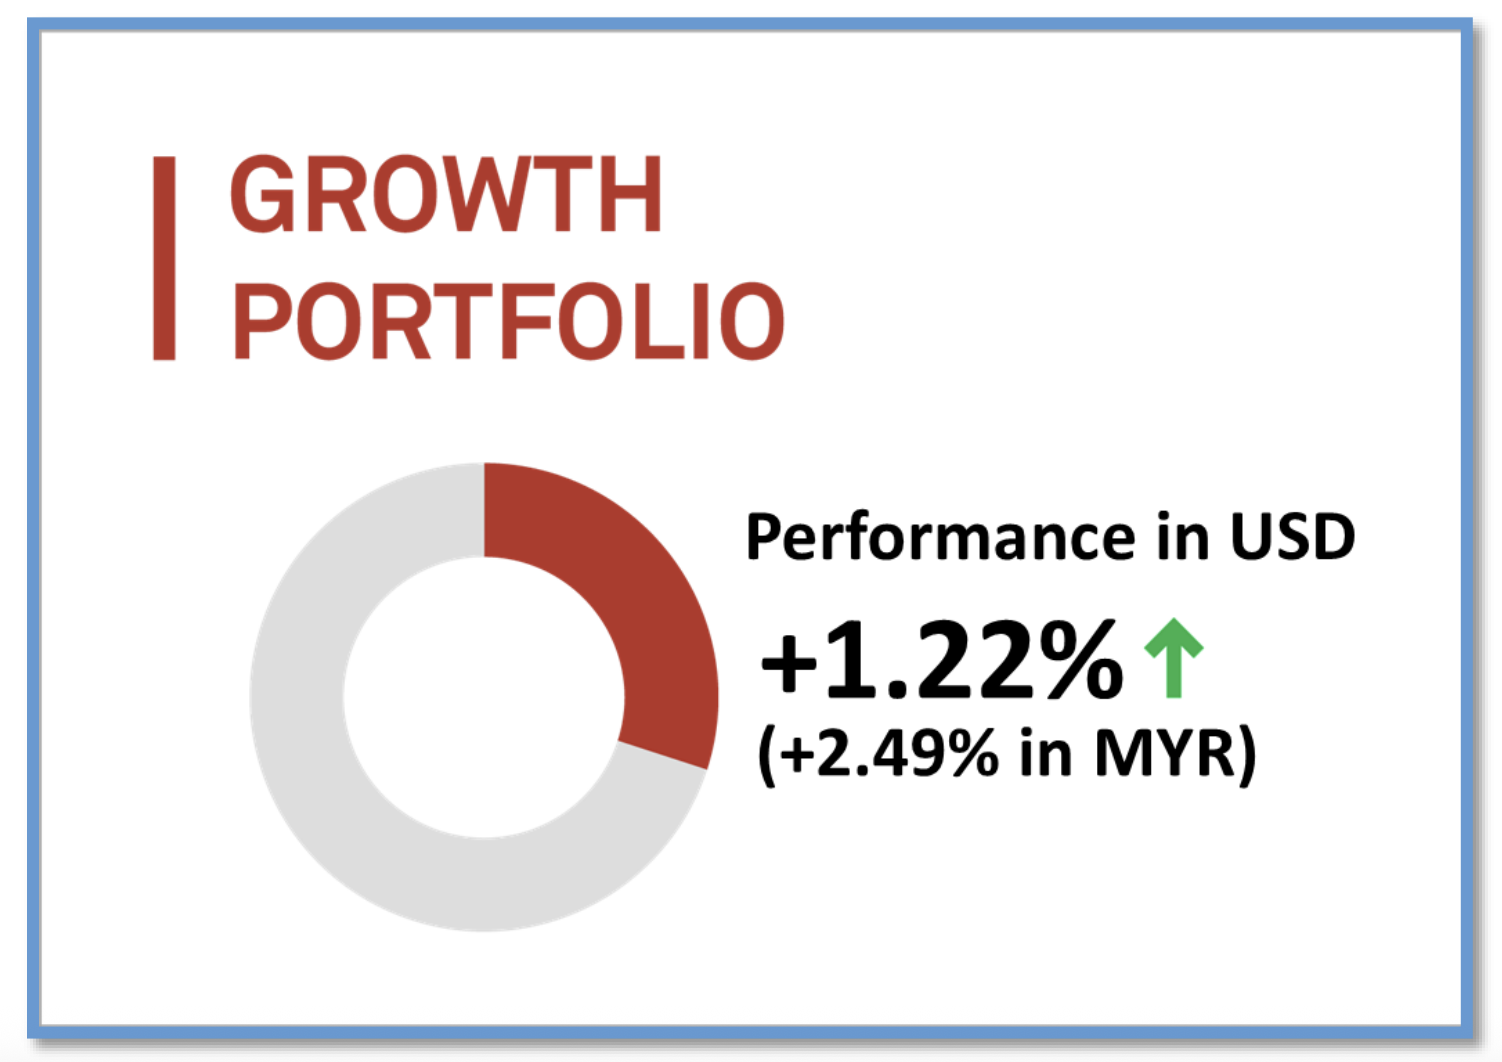
MYTHEO's Growth Portfolio was up by 1.22% (up by 2.49% in MYR) in July 2025.
MYTHEO's Growth portfolio delivered another strong month, extending its upward momentum for the third consecutive month. The impressive performance was largely fuelled by major technology companies, with the growth stocks ETF (VUG) standing out as the top performer within the portfolio.
This strong showing in the technology sector was driven by a wave of exceptional quarterly results announced in July. Tech giants Meta, Alphabet, and Microsoft all reported solid numbers that significantly exceeded market expectations. Meta saw its revenue jump by an impressive 22%, Microsoft by 18%, and Alphabet by 14%. A remarkable growth rates for companies of their size.
Top 3 ETFs performance (Growth portfolio)
Bottom 3 ETFs performance (Growth portfolio)
Source: GAX MD Sdn Bhd, data in USD term for the month of July 2025.
2. Income Portfolio

In July 2025, MYTHEO's Income Portfolio declined by 0.96% in USD terms but recorded a gain of 0.28% in MYR terms.
The month's performance of MYTHEO Income portfolio was shaped by two main factors: a rebound in the US dollar and the Federal Reserve's decision to keep interest rates unchanged.
Among the portfolio's holdings, preferred stocks (PFF) and senior loans (SRLN) delivered the strongest returns. Their higher risk profile and positive correlation with the broader equity market enabled them to benefit from steady market conditions. Floating-rate bonds also performed well, as the Fed's pause on rate hikes means their attractive yields are likely to be maintained in the near term.
On the flip side, US Treasury bonds, especially longer-duration securities such as TLT faced headwinds from the Fed's policy stance. The impact was even more pronounced for government bonds outside the US, as the sharp US dollar rebound weighed heavily on their valuations. Consequently, international treasuries (IGOV) and emerging market bonds (EMLC) were the weakest performers in July.
Top 3 ETFs performance (Income portfolio)
Bottom 3 ETFs performance (Income portfolio)
Source: GAX MD Sdn Bhd, data in USD term for the month of July 2025.
3. Inflation Hedge Portfolio

In July 2025, MYTHEO's Inflation Hedge Portfolio recorded a marginal loss of 0.21% (a gain of 1.04% in MYR).
The Inflation Hedge portfolio posted a mild negative return in US dollar terms this month but delivered a positive gain of over 1% in MYR, supported by the sharp rebound in the US dollar.
At the individual asset level, the Oil ETF (DBO) stood out as the strongest performer, driven by concerns over potential supply disruptions. These concerns were sparked by President Donald Trump's threats of imposing tariffs on US imports from India due to its purchases of Russian crude. The European Union has already restricted the import of seaborne crude oil and refined petroleum products from Russia. India, however, has continued to buy significant volumes of discounted Russian crude, refining it into products such as diesel and gasoline for sale in the global market. This trade has played a key role in keeping large volumes of Russian oil in circulation. Any move to restrict India's ability to continue could tighten the global oil market and push prices higher.
Gold (IAU), traditionally viewed as a safe-haven asset, fell by 2.05% during the month. The decline was largely due to the absence of new geopolitical tensions, which marked a shift from the heightened uncertainties seen in the first half of the year.
International real estate (RWX) also recorded a downturn, likely pressured by the stronger US dollar. Meanwhile, the Mortgage on Real Estate (REM) sector weakened after the Federal Reserve decided to keep interest rates unchanged, removing the potential lift to the real estate market that a rate cut could have provided.
Top 3 ETFs performance (Inflation Hedge portfolio)
Bottom 3 ETFs performance (Inflation Hedge portfolio)
Source: GAX MD Sdn Bhd, data in USD term for the month of July 2025.
4. Global ESG Portfolio
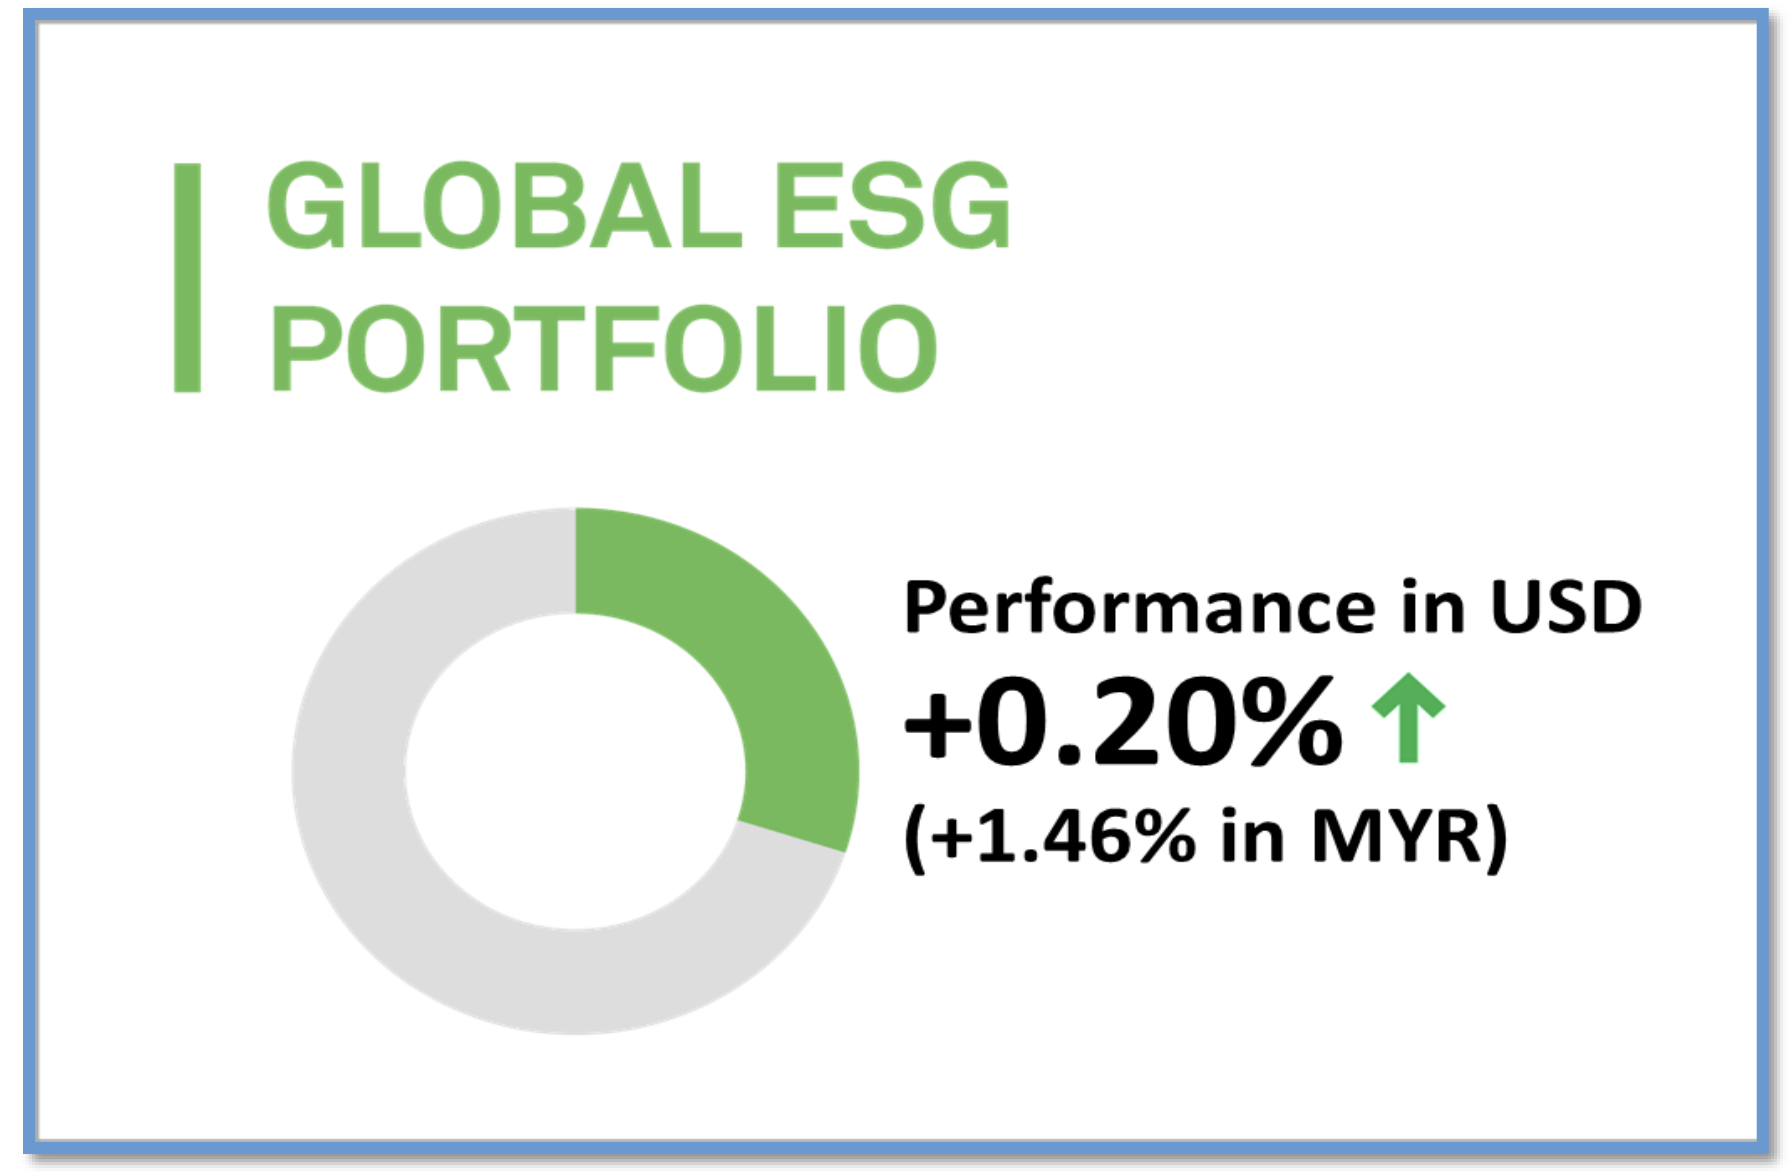
MYTHEO's Global ESG rose by 0.20% (rose by 1.46% in MYR) in July 2025.
The Global ESG Portfolio's performance in July mirrored broader market trends, with overall muted movement and gains concentrated among a few standout performers. Positive returns were driven primarily by the exceptional strength of several large technology companies.
Major tech names such as Nvidia, Alphabet, Microsoft, and Meta all reported strong earnings, while the ESG Large-Cap Growth ETF (NULG) delivered a significant outperformance compared to all other assets in the portfolio.
Outside the technology sector, gains were limited. Assets beyond the US were weighed down by the rebound in the US dollar, which negatively impacted international holdings. This was evident in the ESGD ETF, with its substantial exposure to Europe, Australia, and Asia, which declined 2.21%. Similarly, US ESG Value stocks lacked a catalyst and closed the month with a 0.95% loss.
Top 3 ETFs performance (Global ESG portfolio)
Bottom 3 performance ETFs (Global ESG portfolio)
Source: GAX MD Sdn Bhd, data in USD term for the month of July 2025.
5. Essential Products Portfolio
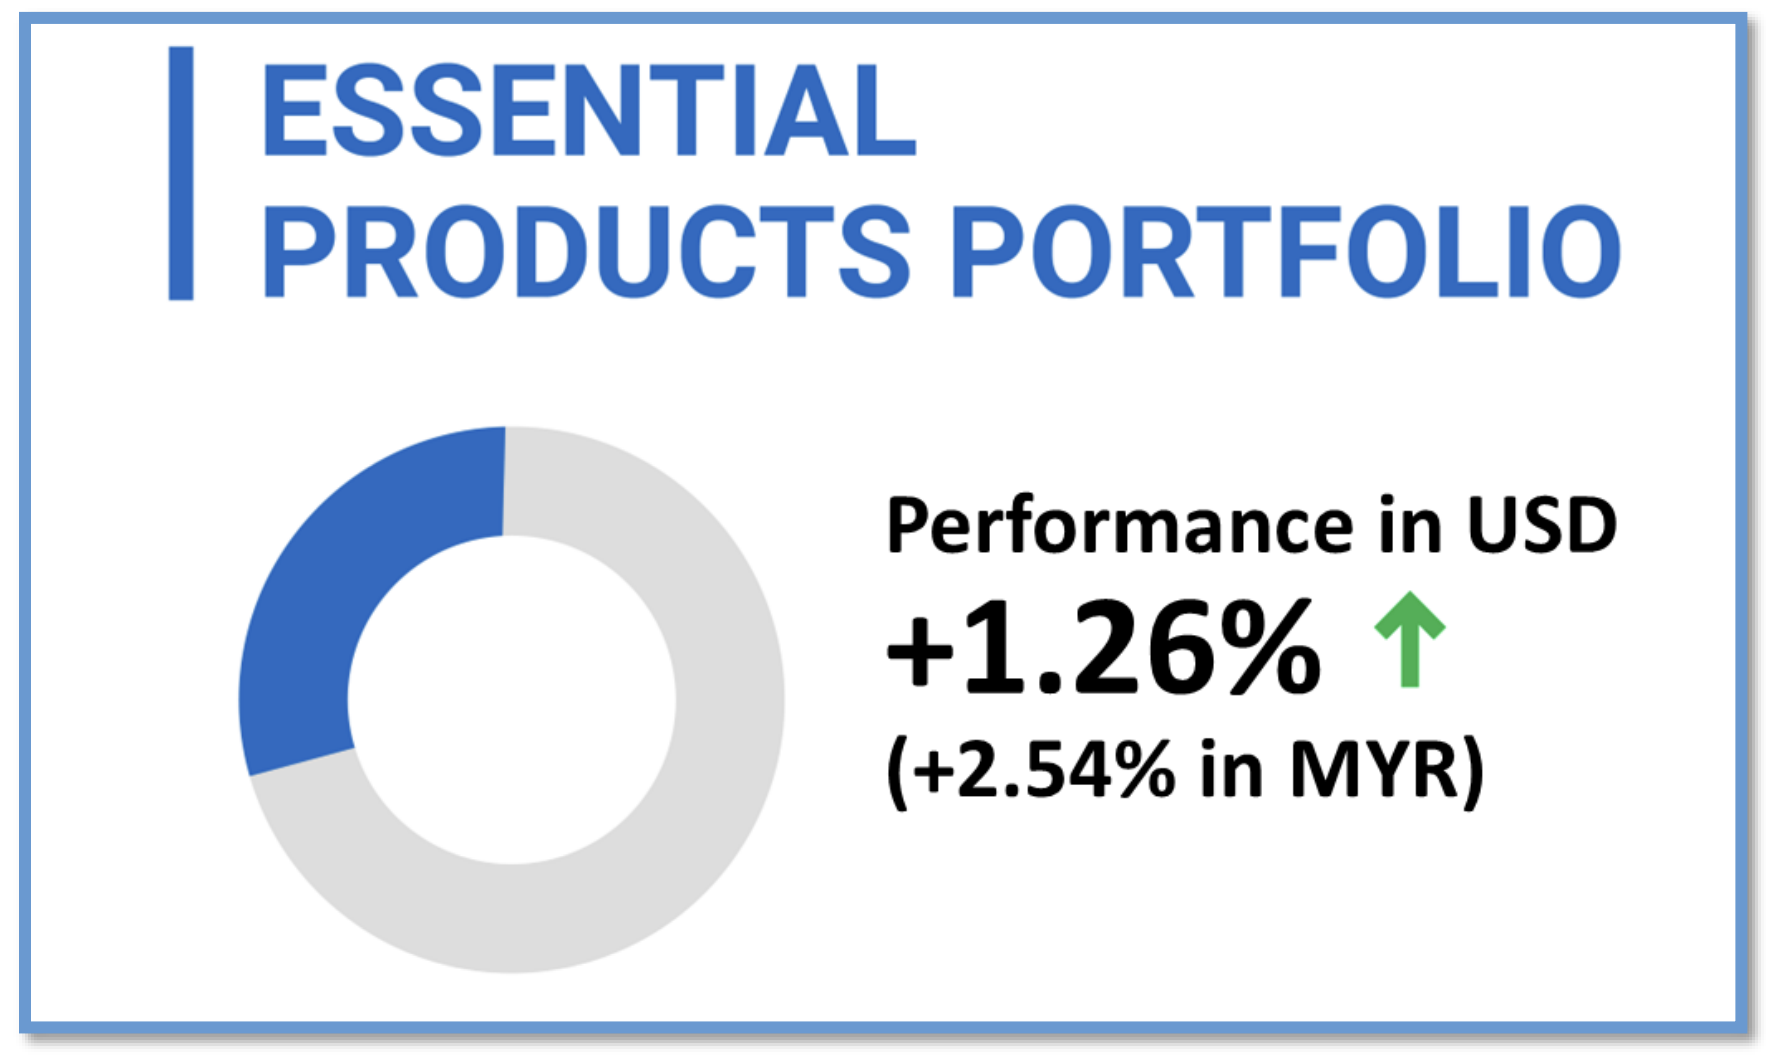
MYTHEO's Essential Products portfolio gain by 1.26% (increased by 2.54% in MYR) in July 2025.
The MYTHEO Essential Products portfolio delivered another positive performance this month, rising by 2.54% on top of impressive gains in the past two months. However, unlike the broad-based performance seen earlier, July's results were more mixed. Still, last month's top gainers continued to lead the charge, with the Global X Lithium & Battery Tech ETF (LIT) gaining 5.10% and the First Trust Global Wind Energy ETF (FAN) rising 1.54%.
As highlighted previously, the electric vehicle battery sector continues to grapple with overcapacity, putting pressure on selling prices and profit margins. At the same time, President Donald Trump's newly signed tax and spending legislation, known as the "One Big Beautiful Bill," removes long-standing federal support for solar and wind energy.
Yet these challenges have not deterred buyers. Value-oriented and forward-looking investors appear to be selectively accumulating positions in the sector, viewing current valuations as attractive entry points after years of underperformance. This buying interest suggests the market may be anticipating a longer-term recovery despite near-term headwinds.
On the downside, agriculture was the weakest performer. The VanEck Agribusiness ETF (MOO), which is largely composed of machinery manufacturers, chemical producers, and commodity traders serving various agricultural sectors, was hit by new US tariffs on Brazil, a key export market for American agricultural machinery and chemicals. In addition, the continued decline in soybean prices weighed on the sector, with prices falling nearly 12% from January to July 2025.
Top 3 ETFs performance (Essential Products portfolio)
Bottom 3 ETFs performance (Essential products portfolio)
Source: GAX MD Sdn Bhd, data in USD term for the month of July 2025.
6. Izdihar Portfolio
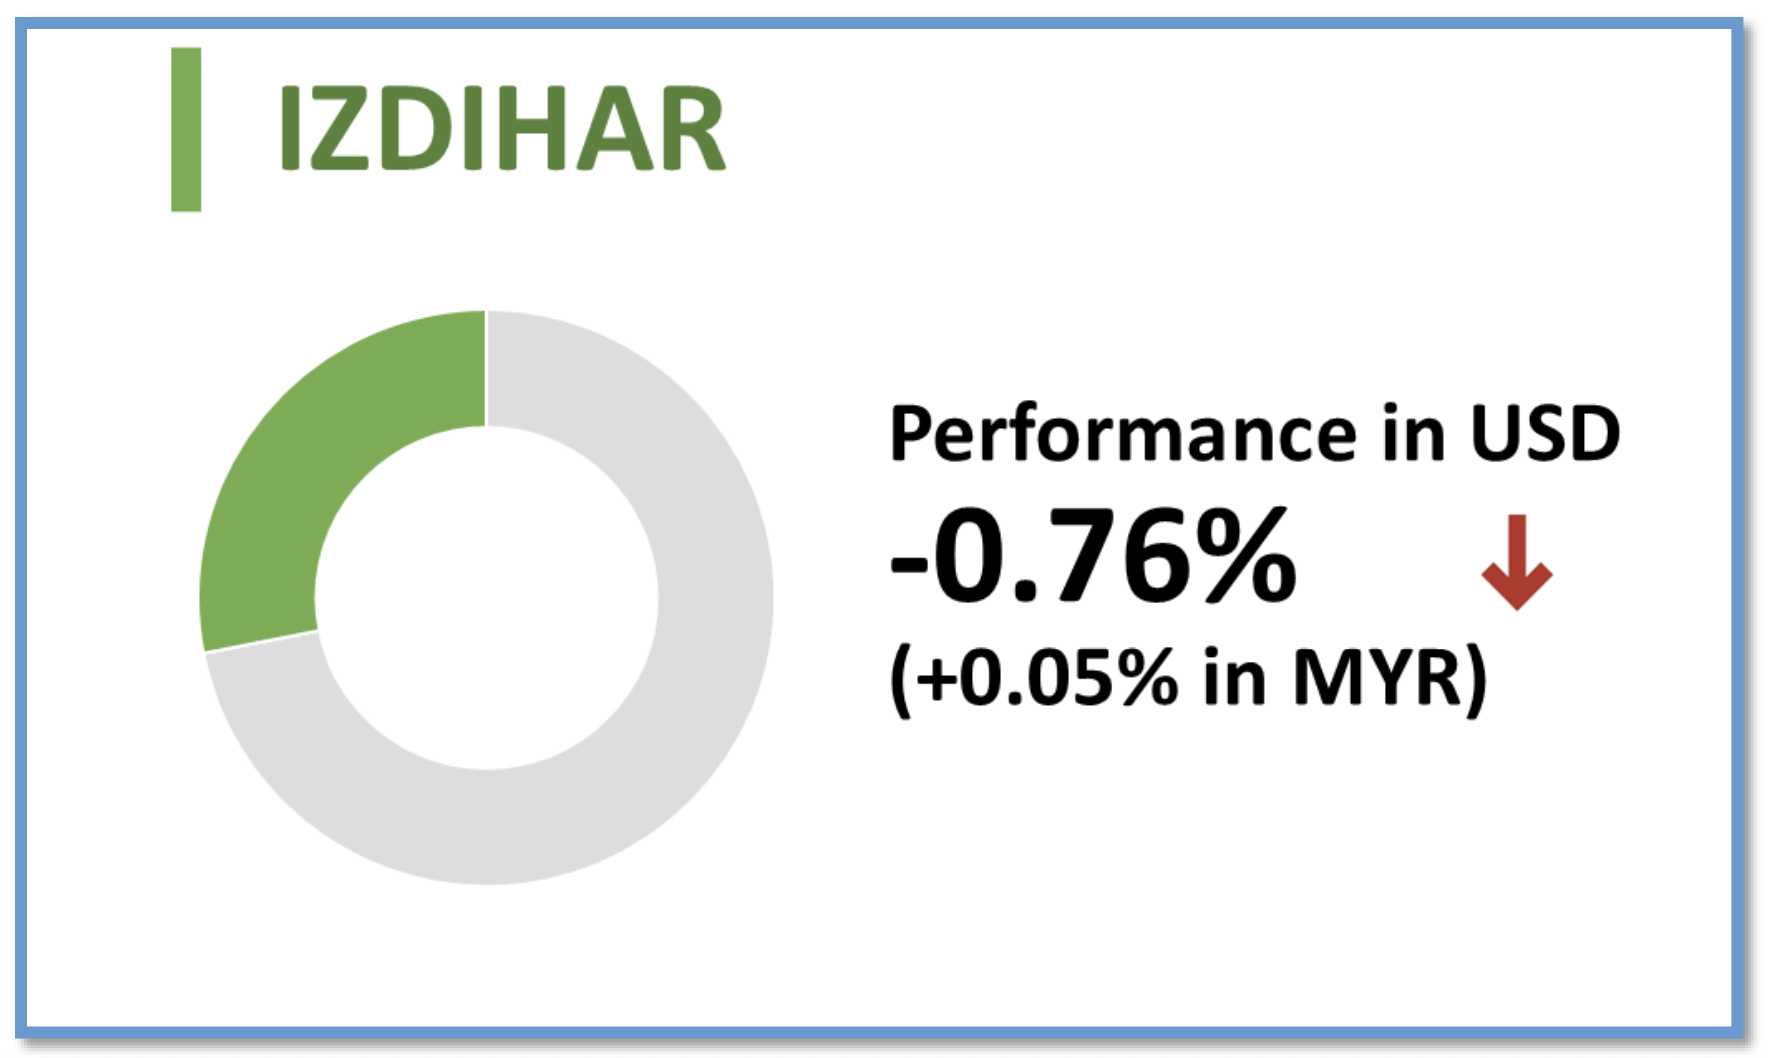
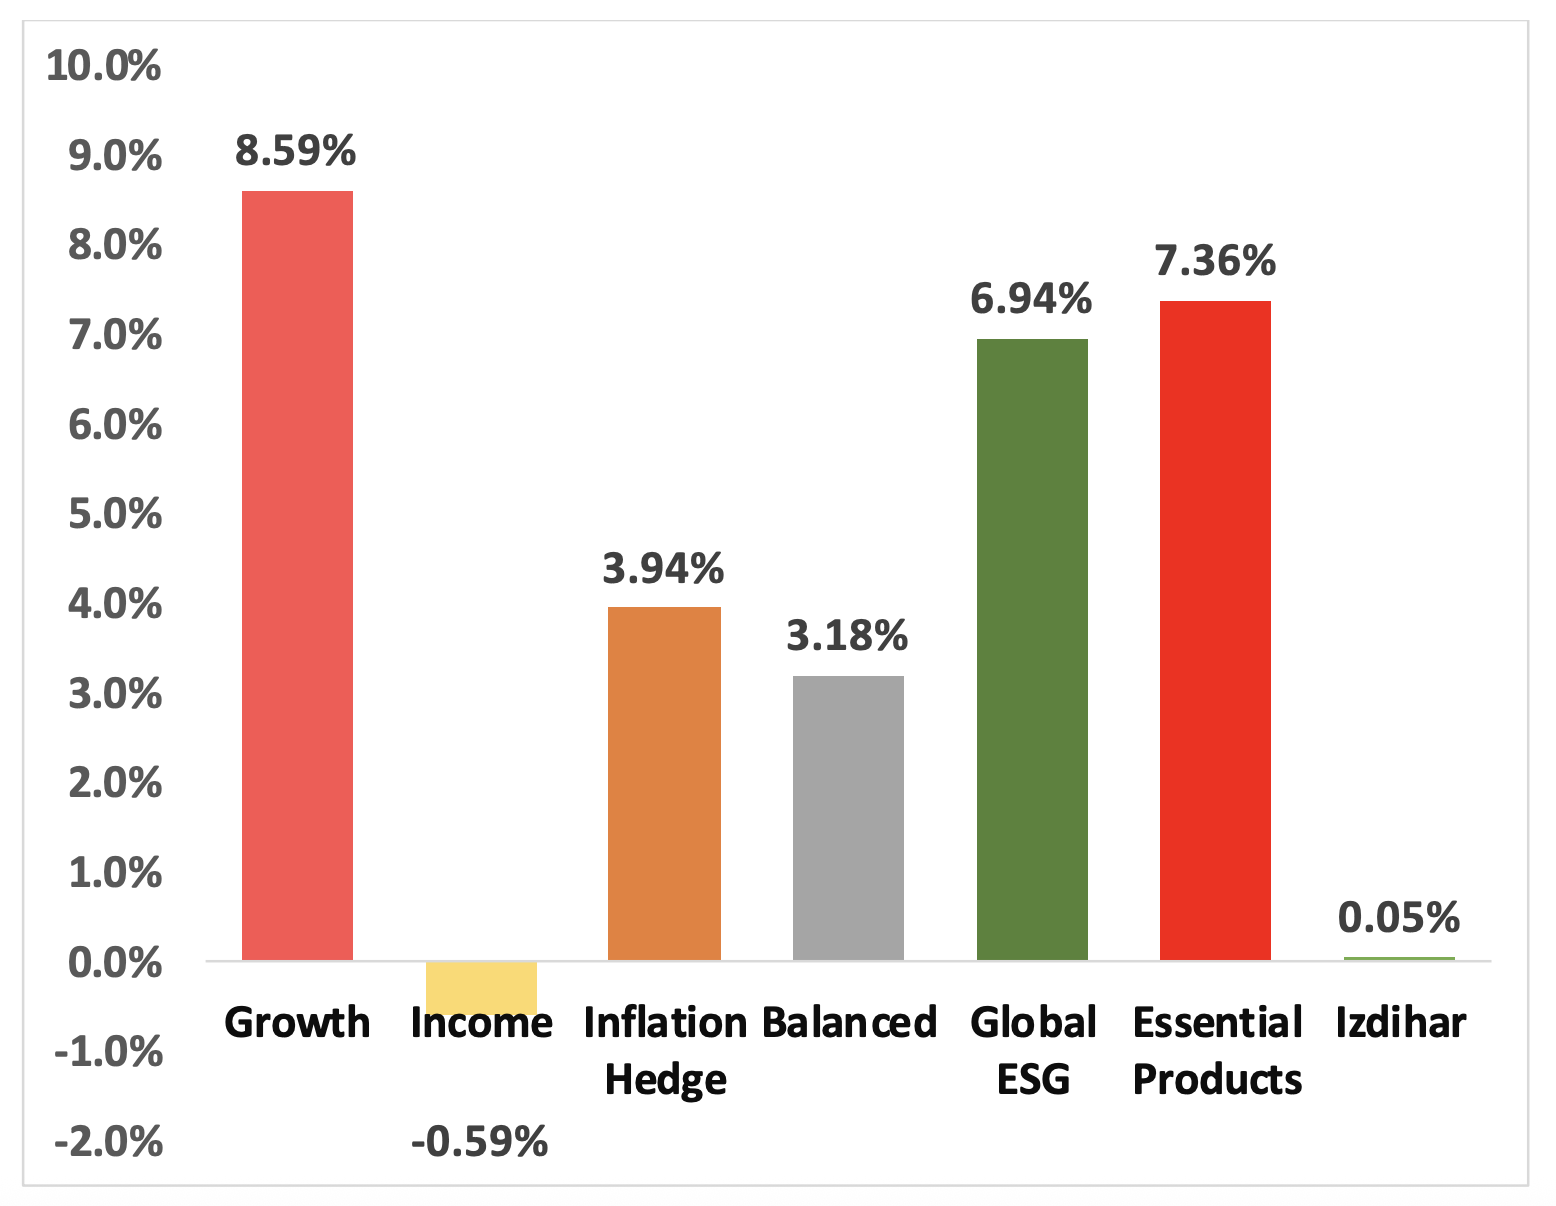
MYTHEO Izdihar portfolio loss by 0.76% (marginal increased 0.05% in MYR) in July 2025.
MYTHEO Izdihar was officially launched on 17th July 2025, introducing a Shariah-compliant, growth-focused portfolio with strong exposure to global technology and innovation-driven companies.
In its debut month, performance was led by US equity exposure through the SPUS ETF and HLAL ETF. The SPTE ETF, with its balanced mix of US and non-US holdings, also delivered steady results. In contrast, ETFs with heavier exposure outside the US, such as UMMA and SPWO, posted negative returns, driven by weaker international markets and the impact of a stronger US dollar.
Top 3 ETFs performance (Izdihar portfolio)
Bottom 3 ETFs performance (Izdihar portfolio)
Source: GAX MD Sdn Bhd, data in USD term for the month of July 2025.
Chart 1: YTD Portfolio Return in % (MYR)
Source: GAX MD Sdn Bhd, July 2025
Note: Past performance is not an indication of future performance
Balanced allocation consists of 30% Growth, 47% Income and 23% Inflation Hedge
Performance Top AI Companies in the US for the month of July 2025 in US Dollar

Source: Gax MD, August 2025.
On July 30, the Federal Reserve kept interest rates unchanged at 4.25%–4.5% for the fifth consecutive meeting, resisting political pressure from President Donald Trump. Nine of the eleven voting members supported the decision, citing "somewhat elevated" inflation and a "solid" labor market as justification.
Equity markets extended their rally, with the S&P 500 closing the month at 6,339.39, up 2.17%, after hitting an all-time high of 6,389.77 on July 28. The Nasdaq outperformed, rising 3.70% and crossing the 21,000 level for the first time on July 23. The gains were driven largely by the strong performance of mega-cap tech leaders Alphabet, Microsoft, and Meta, which continued to anchor market momentum.
Going forward, while most of the "Liberation Day" tariff news may be behind us, Donald Trump's rhetoric is far from over. The latest announcement requiring Nvidia and AMD to pay 15% of their China chip sales revenue to the US government marks a new twist. This effectively imposes a tariff on US exports, not just imports. With ongoing semiconductor restrictions and the potential for pharmaceutical and other sectors to be targeted next, more policy-driven uncertainty lies ahead.
Despite this, markets are likely to become increasingly immune to Trump's unpredictable moves. In particular, large-cap US tech companies are global players with resilient product demand, have shown minimal impact. The strong price performance in July was no accident; it was backed by solid financial results, underscoring their resilience.
As a global investing platform MYTHEO is well-positioned through its holdings in these companies to help you navigate and potentially benefit from the uncertainty surrounding Trump's policies.
Discover how MYTHEO can enhance your portfolio diversification today and embark on your financial journey with confidence. Take the first step towards your financial goals now .
This material is subject to MYTHEO’s Notice and Disclaimer.


